Spinning beach ball has been visiting for a few weeks on 26.2 on a M4 Pro Mini along with periodic slowness and even full-on stop sometimes. Now disrupting work enough to do something about it. Booting in safe mode doesn’t seem to stop this nonsense.
I had similar slowdowns and my issue was my disk was full. Why it was full is an interesting story of OneDrive turning on a sync I didn’t want turned on during an update. Once I cleared space, my slowness went away.
Operating systems always report this relative to a single CPU core. A process using 350% means it is running on multiple CPU cores (probably via multiple threads) and the total load consumed is equivalent to the capacity of 3.5 cores.
Fair enough on the internal drive space. I think the big process hog is Spotlight. Do you work in large files and perhaps have a massive drive attached to your computer? It wants to be indexing the heck out of something. Maybe this is just a red hearing.
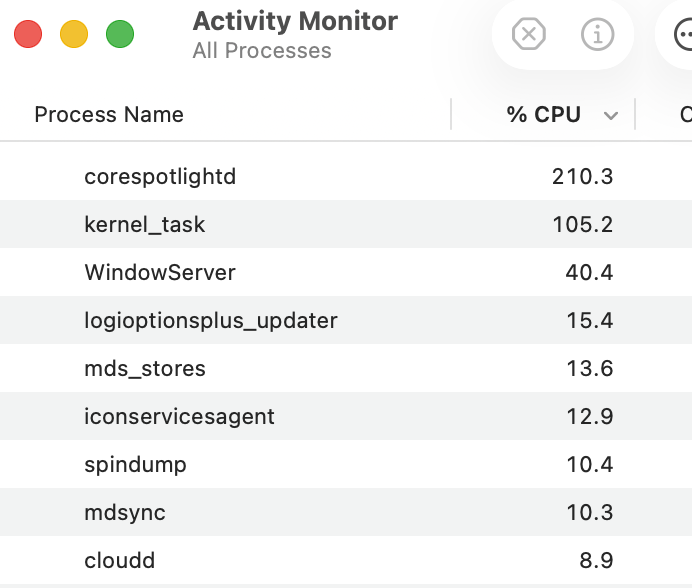
The second process from the OP’s screenshot that caught my eye was spindump (the first was the very large CPU consumption by corespotlightd). Correct me if I’m wrong, but that process shouldn’t be running unless there has been an OS-level crash at some point, should it? Others here may have more expertise, but there may be something else going on here to account for the beachball than just an over-eager Spotlight indexing process.
It seems to me that mdsync and cloud are really quite high too. I wonder if it is worth trying to rebuild the Spotlight index. Maybe it got corrupted after a crash (or a forced quit).
No suggestion of that @jonmcintosh , @Shamino clarified above. I used to work as a pilot and it’s not unusual for various systems to show over 100%. With %s, we always have to dig a bit deeper to find out what’s being measured…
A percentage is always relative to some basis. When someone says “100%” without qualification, you should always think “100% of what”?
For instance, gauges on mechanical equipment (like an engine or a generator) might read "100% of rated capacity’. You could push it to greater than 100%, but doing so will run the risk of damaging it.
I’m reminded also of when you see in the movies, some ship’s captain may call for “ramming speed”. And some viewer always says “how fast do you need be in order to ram something?”, not understanding what the term actually means. (“Ramming speed” is a command to turn off all of the collision alarms and speed regulators and push the engines to the maximum because you intend to have a collision and no longer care about damaging the ship’s systems.)
In the meantime, I’ve been working in safe mode with no issues. When I have time next week I’ll ge back into troubleshooting and if I discover anything that may be helpful to fellow TB’ers I’ll be happy to share.
The gist of Howard Oakley’s article is that CPU percentage usage on Apple Silicon isn’t what you think it is (and even on Intel Macs with HyperThreading).
The percentage value refers to residency - the percentage of time that processes are using a CPU core. That works fine when cores run at a fixed clock rate. But they don’t. The CPU% figure doesn’t take into account the CPU clock rate that macOS is using when running processes on that core. The cores may be 100% active running a process (which is what the CPU % metric is), but running at low clocking.
@jonmcintosh Given that Spotlight is most likely running on the e-cores (and you can tell through the activity monitor CPU graphs which types of cores are getting used), I’m wondering if Spotlight might not be the problem. Spotlight running on run on lower-priority e-cores makes it less of a burden to the system overall.
Even more interesting is that you say that you are now working in Safe Mode. I’d take a look at the software/drivers/extensions/background itrems/etc that aren’t starting up in Safe Mode and see if they might be contributing to the problem (making sure that they’re all updated for Tahoe for example)
One thing I’m seeing on the Activity Monitor screen shot is that this Mac may be running Logitech’s Logi Option+ software (there’s a logioptionplus_updater process running which I believe is part of that software). A bit of digging shows that Logi Option+ software versions prior to 1.98.824948 have an expired signing certificate: Expired certificate completely breaks macOS Logitech apps, user customizations - Ars Technica
This issue not only seems to keep the software from launching properly, but also prevents the software from updating itself to newer versions that fix the issue. You might want to check the version of this package that’s installed, and if necessary update it manually by downloading and installing the latest version from Logitech.
I’ve been seeing the ‘spinning pizza of death’ ever since upgrading to OSX 26, particularly in Music. Operations which used to happen almost immediately now produce the pizza, even on 26.3. I’m using a MacBook Pro with Apple M1 Pro chip, 16 GB of memory and plenty of free disk space. It’s frustrating
I am no expert, but I have done a lot of fumbling around with betas of various products. My understanding is that spindump is triggered by macOS when a process takes “too long” to complete. What is considered “too long” can be a judgement call, depending on the process(es) involved. Spindump prepares a report of what the system is doing, in an attempt to reveal points in which optimization might benefit the slowed calling process, and the processes and data involved at that particular moment.
So seeing spindump activity is a good sign. Spindump shows the system has detected beach balling. Spindump is alerting macOS programmers of the need for modification, and is supplying data that may facilitate code improvement.
Spindump runs a lot in early betas, then less later as code becomes more optimized. Appearance in released versions indicates possibilities for improvement remain.