TL;DR: This isn’t unusual, and it doesn’t necessarily mean apps are leaking memory.
Although some languages like Java have built-in robust garbage collection, many other languages (e.g. C and C++) do not and rely on the app developer managing his own memory and/or a third-party garbage collection library.
Even Objective-C doesn’t to this, but it does employ a robust system of reference counting to auto-delete unused objects. (I don’t know what Swift does).
But this is all realtively high-level. Under the covers, most modern operating systems (including Linux, BSD and by extension, macOS) use a very simple memory allocation system under the covers. They implement what’s known as a “break region”.
When an app loads, the kernel allocates stack space at the top of its memory (typically starting at the 4GB line and working down for 32-bit apps, somewhere else for 64-bit apps). The app’s code and global data occupies space at the bottom of the process’s memory. A “heap” for dynamic storage begins immediately above the code/data region and dynamically grows as memory is allocated:
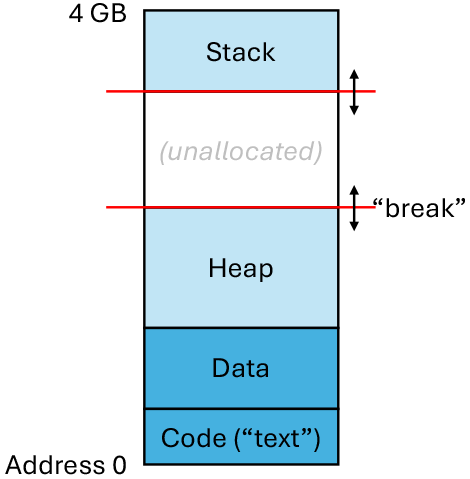
The “break” is the highest address available to the heap. Low-level APIs, brk and sbrk manipulate the position of this break address.
Application-level memory allocators, whether it is C’s malloc, C++'s allocation system (which usually layers over malloc), or Java’s memory allocator, all work at their lowest levels by manipulating the break address.
When you allocate memory for an object, the system checks to see if there is sufficient free space in the heap. If there is, your object is allocated from that memory. If there isn’t, it will make the heap larger by increasing the break address. Then it will allocate your object from the newly-expanded heap.
So what happens when you free an object? The system will add that object’s memory to an internal free-list. That is a data structure that tracks all unused memory. But that’s all it does. The memory will be reused for new allocations, but it is never returned back to the system. In other words, the break address is never decreased.
Why is it done this way? Because it usually works best this way. You can’t decrease the break region unless the object you just deleted is at the top of the heap - where there is no object allocated at any higher address. For a running system, where objects are being allocated and freed all the time all over the place, this actually doesn’t happen very often.
And even when it does happen, for most real-world apps, it is highly likely that future allocations will force the app to increase the break region later. So why free the memory only to request it back again?
How could you work around this? Well, you could design your system so that the OS can dynamically move objects around in memory. If it can move objects to lower addresses (so the free space bubbles to the top of the address space), then you could decrease the break and free memory back to the OS. But this means applications can no longer retain pointers to in-memory objects, because those objects could move without warning.
Interestingly, Classic Mac OS did just that. It was necessary for apps to run on systems like a Mac with small amount of RAM and no virtual memory (e.g. a Mac 512, or Plus or SE). When an app allocates an object it gets a “handle” (effectively an ID number) to it. In order to access the object, apps must “lock” the object in order to get a valid memory pointer. Then it must unlock the object, making that pointer invalid. This way, the OS can move the object around in memory. The handle will remain valid, but the next time it is locked, it may return a different memory pointer.
But with the invention of virtual memory, that mechanism fell by the wayside. It’s a pain in the neck for developers, and if you have virtual memory, you don’t have to worry (as much) about your free memory getting fragmented.
The upshot of all this is that the amount of memory the OS has allocated to a process is not necessarily the amount that the app is actually using, but is the high water mark of all the memory that it has used since it started. And that memory doesn’t get returned to the OS until the application quits.
And normally, this isn’t a problem. If an app has a lot of unused memory (e.g. a large heap with a lot of free space) and something else needs that memory, it will get paged out to the swap file, and it won’t get paged back in until/unless it is actually needed again. So you’ve lost a bit of storage, but probably not a lot, given the large size of storage devices these days.
But it does means that certain apps that may allocate and free large amounts of memory (like an app that works on large documents) may end up consuming a lot of memory it doesn’t need at the moment. And if your file system is approaching full, it may not be able to copy that memory to the file system. Your only option is to quit the app(s) when you’re not using them. Which I’ve always considered to be good practice anyway.
This is also one of the reasons that web browsers these days frequently spawn child processes for each tab you open. This way when you close the tab, its process goes away, and the memory consumed by that process also gets returned to the OS. Which is really important for those people who never want to quit their browsers.